Where Strategy Builders Give Up: 7 Scenarios When You Can't Avoid Code

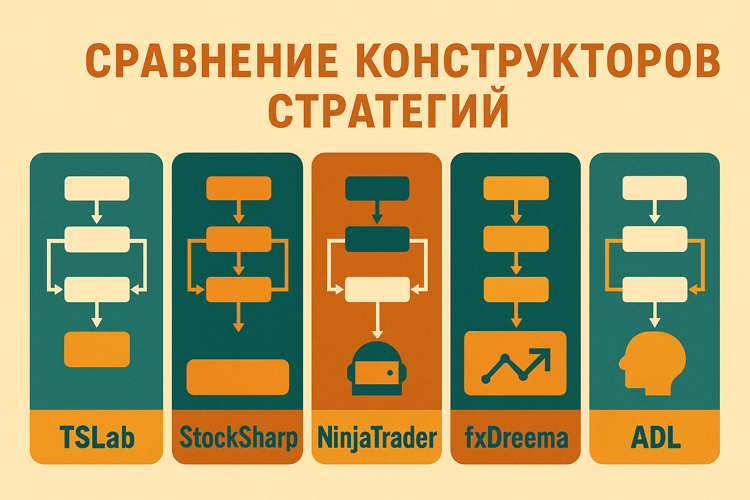
A month ago, I compared five visual strategy builders. The conclusion was simple: for basic indicator strategies, they work great.
But I started digging deeper. What happens when the task gets more complex? Where is the line between “this can be built in a builder” and “it’s time to write code”?
It turns out that line is very clear. And it can be described through specific scenarios.
1. When You Need a Custom Indicator
Problem: Visual builders offer 50-100 built-in indicators. This covers 90% of classic strategies. But what about the remaining 10%?
Real case:
You want to use a custom indicator — for example, a modified RSI version with a volatility correction. Or an indicator from a research paper that isn’t in the standard library.
TSLab has ~60 indicators. NinjaTrader — over a hundred. But if your indicator isn’t on the list — you’re stuck.
Partial solutions:
- NinjaTrader lets you write custom indicators in C# and connect them to Strategy Builder
- TSLab supports writing indicators in C# via Script Lab
- fxDreema doesn’t offer this at all — only ready-made blocks
When code is definitely needed:
If your strategy is built around proprietary math that can’t be assembled from standard blocks — the builder won’t help. You’ll have to code.
2. Machine Learning and Predictive Models
Problem: Visual builders operate on binary logic. “If RSI > 70, then sell.” Machine learning works differently — the model outputs probabilities, not clear “yes/no” answers.
Real case:
You’ve trained an LSTM model to predict price over the next 5 minutes with 65% accuracy. The model doesn’t output “buy” or “sell” but a probability distribution: +2% with 40% probability, -1% with 30% probability, +0.5% with 30% probability.
How do you integrate this into a flowchart?
Why builders can’t handle this:
- You need to load a trained model (usually a pickle file or ONNX)
- Feed it the current market state (dozens of features)
- Get a prediction
- Make a decision based on probabilities, not hard conditions
Neither TSLab, Designer, nor NinjaTrader support importing ML models through a visual interface.
What the industry does:
Write code. Python + libraries (scikit-learn, TensorFlow, PyTorch) for training. Then integrate the model into the trading system via API.
3. Statistical Arbitrage and Pairs Trading
Problem: Pairs trading requires simultaneous work with multiple instruments, cointegration, z-score calculation of the spread. Flowcharts aren’t designed for this.
Real case:
You want to trade a Gazprom/Lukoil pair:
- Calculate cointegration between instruments
- Build the spread
- Compute the z-score deviation from the mean
- Open positions when z > 2 or z < -2
- Close when the mean reverts
What you need in code:
# Cointegration calculation
from statsmodels.tsa.stattools import coint
_, pvalue, _ = coint(gazprom_prices, lukoil_prices)

# Hedge ratio calculation
hedge_ratio = np.polyfit(gazprom_prices, lukoil_prices, 1)[0]

# Spread and z-score
spread = lukoil_prices - hedge_ratio * gazprom_prices
zscore = (spread - spread.mean()) / spread.std()
Conclusion:
Pairs trading is about statistics and math, not “if SMA crossed.” Builders aren’t built for this.
4. Complex Risk Management
Problem: Visual builders handle simple stop-losses and take-profits well. But what if risk management is more complex?
Real case:
You want to implement the Kelly Criterion — position size depends on win probability and risk/reward ratio:
Position Size = (Win% * (Avg Win / Avg Loss) - (1 - Win%)) / (Avg Win / Avg Loss)
This requires:
- Calculating statistics of the last N trades
- Computing win rate in real time
- Dynamically changing position size
When code is needed:
Any adaptive logic — portfolio allocation based on correlations, dynamic hedging, VaR/CVaR-based risk management — requires code.
5. High-Frequency Trading
Problem: Visual builders add an abstraction layer. That layer costs milliseconds.
Real numbers:
Professional HFT works in microseconds. Single-digit tick-to-trade — less than 5 microseconds.
Visual builders work in milliseconds. TSLab, Designer, NinjaTrader — all interpret flowcharts at runtime.
Conclusion:
If you’re planning HFT — visual builders aren’t even in the picture. This is about C++, low-level optimizations, and hardware.
For retail traders on minute/hourly timeframes, a 50-100ms delay is non-critical. For HFT — it’s an abyss.
6. Complex Portfolio Strategies
Problem: Builders are designed for one strategy on one instrument. What if you want to manage a portfolio of 20 stocks with rebalancing?
Real case:
You want to implement Mean-Variance Optimization (Markowitz Portfolio):
- Take 20 stocks
- Calculate the return covariance matrix
- Find optimal weights to maximize Sharpe Ratio
- Rebalance the portfolio weekly
What you need in code:
from scipy.optimize import minimize

def neg_sharpe(weights, returns, cov_matrix):
    portfolio_return = np.dot(weights, returns.mean())
    portfolio_vol = np.sqrt(np.dot(weights, np.dot(cov_matrix, weights)))
    return -(portfolio_return / portfolio_vol)

result = minimize(neg_sharpe, initial_weights, args=(returns, cov_matrix))
optimal_weights = result.x
Conclusion:
Portfolio strategies require matrix computations, optimization algorithms, and simultaneous work with dozens of instruments. Builders weren’t created for this.
7. Integration with External Data
Problem: Builders give access to exchange data (prices, volumes, order book). What if you need data from outside?
Examples:
- News sentiment analysis via API (Bloomberg, Reuters)
- Alternative data (weather for crops, satellite images of parking lots for retail)
- Macroeconomic indicators (Fed rate, inflation, PMI)
Conclusion:
As soon as data goes beyond “price/volume/indicators” — builders are powerless.
So When Do Builders Work?
After all these cases, you might think visual builders are useless. That’s not true.
Builders are great for:
- Classic indicator strategies — MA crossovers, RSI/MACD/Bollinger Bands, candlestick patterns
- Quick prototyping — test an idea in 15 minutes, run a backtest
- Learning algorithmic trading basics — understand how strategies work without worrying about syntax
Builders do NOT work for:
- Machine learning
- Statistical arbitrage
- Custom math (Kelly, Markowitz, cointegration)
- High-frequency trading
- Portfolio optimization
- External data integration
- Complex adaptive risk management
What to Do When You Hit the Boundary?
Option 1: Hybrid approach — many platforms allow writing custom blocks in code (TSLab: C# via Script Lab, Designer: C# indicators, NinjaTrader: C# custom indicators).
Option 2: Switch to code — Python + Backtrader/LEAN/PyAlgoTrade, C# + StockSharp/LEAN, MQL5 for MetaTrader.
Option 3: Use AI as a crutch — generate strategy code via ChatGPT/Claude. Not a replacement for programming, but it lowers the entry barrier.
Conclusions
Visual builders are a compromise between simplicity and capability.
They cover 80% of retail algorithmic trading tasks. But the last 20% — ML, arbitrage, portfolio optimization, data integration — require code.
If you’re just starting: Builders are a great start. StockSharp Designer is free, TSLab offers a demo, fxDreema runs in the browser.
If you plan to seriously pursue algorithmic trading: Learn programming. Basic Python + algotrading libraries is enough for 99% of tasks.
The no-code boundary exists. And it lies exactly where standard logic ends and mathematics begins.
Useful links:
Share this article:
Related Posts


Discussion
Join the discussion in our Telegram chat!