StockSharp Designer: Free Trading Bots Without Code
StockSharp Designer is when you build a trading bot from visual blocks with your mouse, completely free, and you have the source code of the entire platform on GitHub. Sounds like a joke? No, it’s a real product, and let’s figure out why it’s free and whether there’s a catch.
What It Is
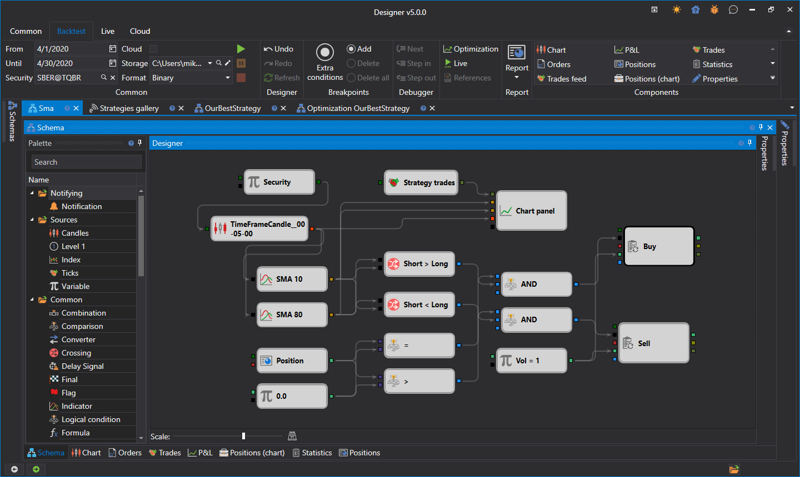
Designer is a visual strategy builder from StockSharp. You literally assemble a trading bot from ready-made blocks: drag an indicator, connect it to a condition, add a buy signal – done. No code, no if-else, no arrays.
The main feature: It’s completely free and open-source.
There’s no paid version. No 30-day trial. No “buy the full version for $600 a year.” Just download, install, and use.
The natural question: If it’s free, where’s the catch?
The catch is that StockSharp doesn’t make money from Designer. They sell enterprise licenses to companies, consulting, and custom development. Designer is a showcase for their framework. If you like it, you might eventually want to hire them for a serious project. Simple business model.
How It Works
The logic is simple:
Want a bot based on moving average crossovers? Take a “Price” block, two “SMA” blocks with different periods, a “Crossover” block, a “Buy” block. Connect them with lines. Run a backtest. See the results.
All of this in 20-30 minutes without a single line of code.
Example:
Price -> SMA(20) \
                  -> Crossover Up -> Buy
Price -> SMA(50) /
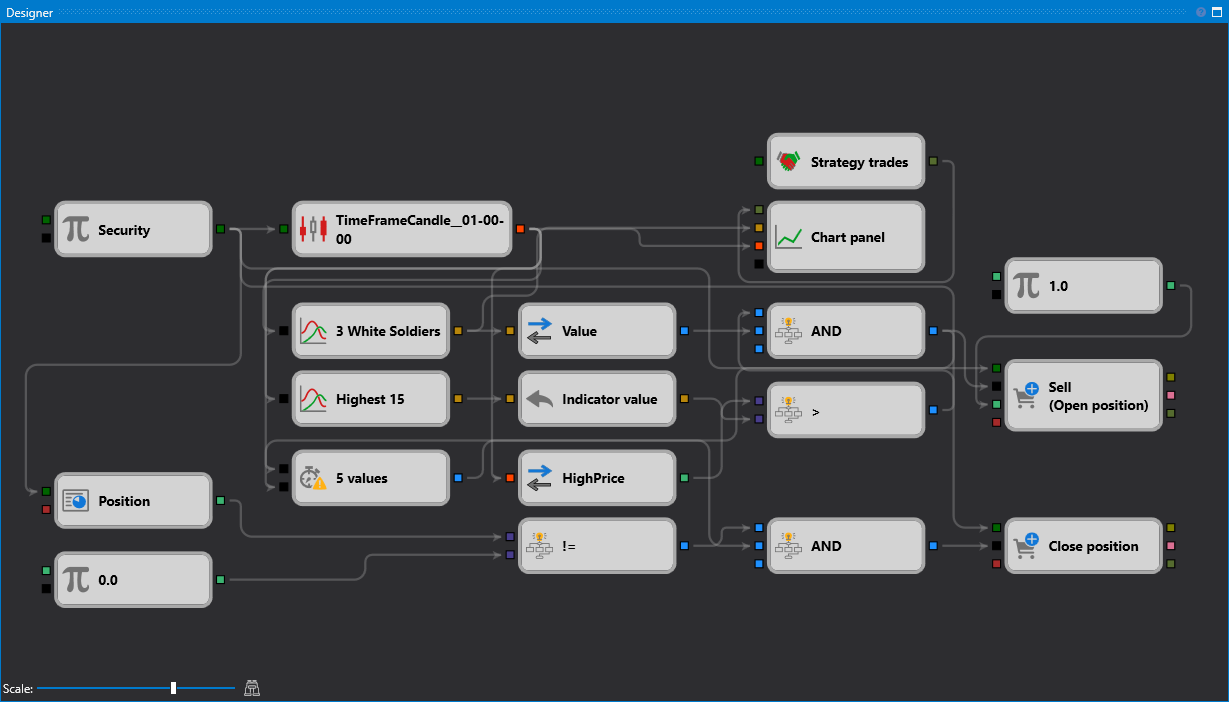
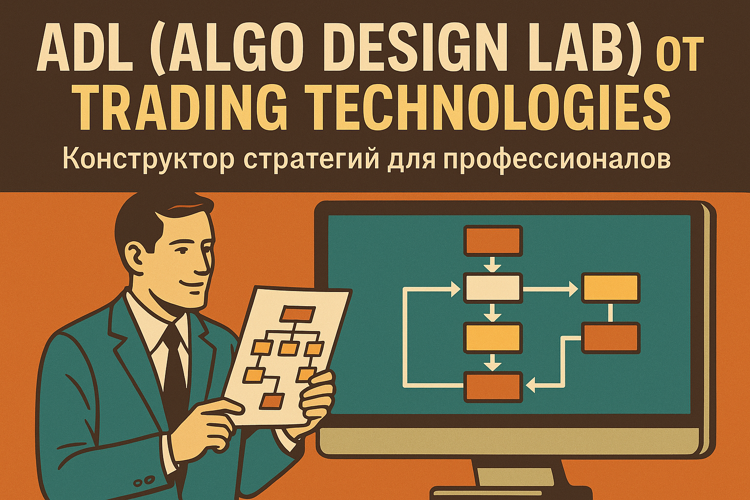
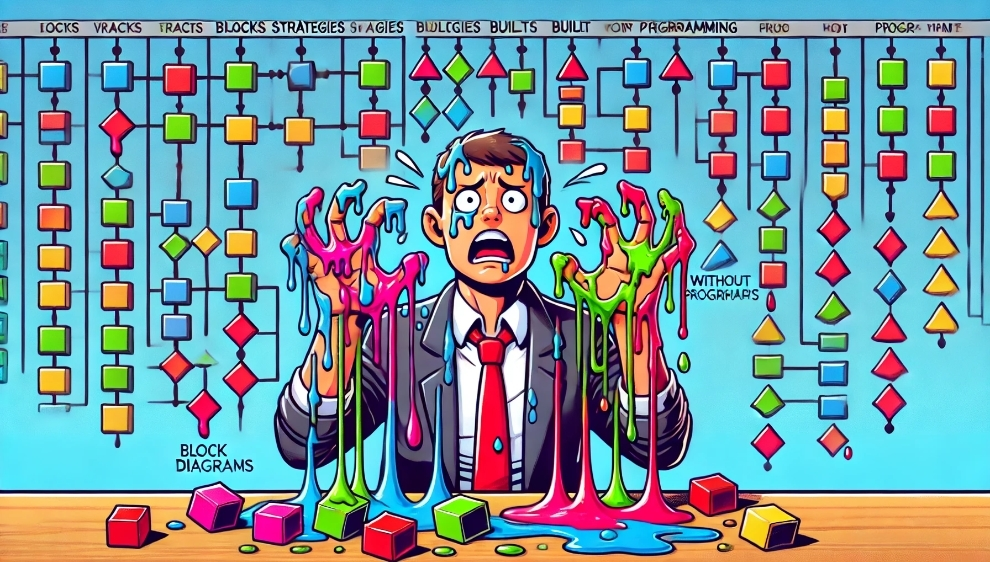
Visually, it looks like an algorithm flowchart from a CS textbook, except instead of “start-end” you have indicators and trading signals.
What It Can Do
Out of the box:
- Tons of indicators (SMA, EMA, RSI, MACD, Bollinger Bands, Stochastic, and about 60 more)
- Logic blocks (AND, OR, NOT, comparisons, conditions)
- Trading actions (buy, sell, stop-losses, trailing stops)
- Backtesting on historical data
- Parameter optimization (finding best values)
- Broker connections (domestic and international)
Brokers:
- Russian: QUIK, Transaq (Finam), ALOR API, Tinkoff Invest, BCS
- International: Interactive Brokers, Binance, BitMEX, Bybit
- Any broker with FIX API or REST API (you can write your own connector)
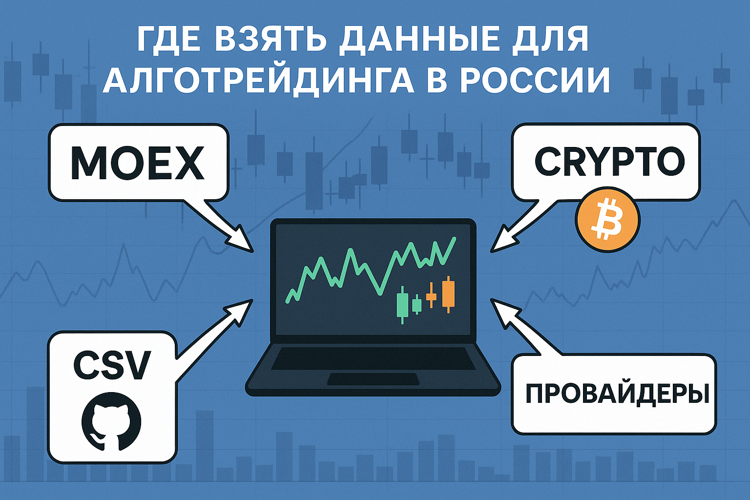
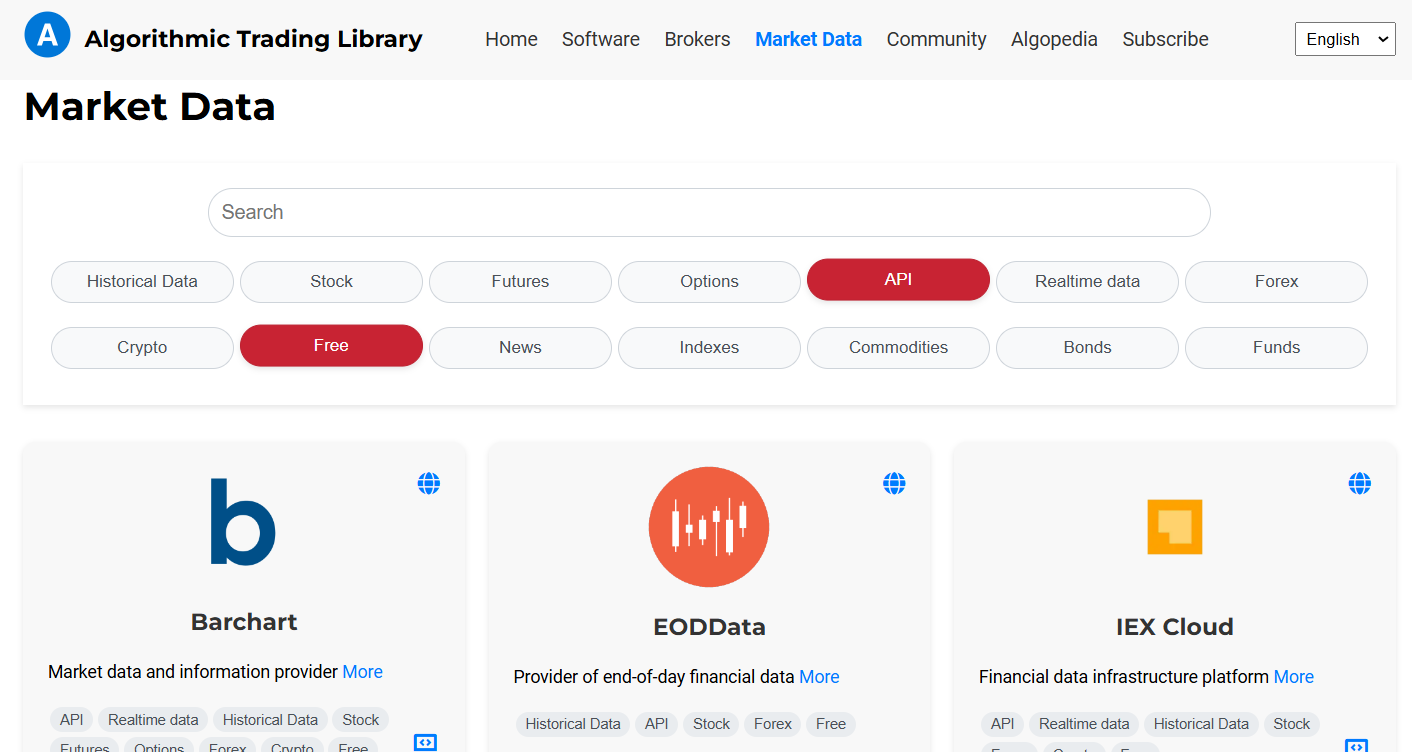
Data:
- CSV files (import historical quotes)
- Finam Export (free data from Finam)
- Direct broker connection (real-time quotes)
The Key Difference from Other Builders
This is where Designer pulls sharply ahead of competitors like TSLab.
The strategy is not tied to Designer.
You build a strategy in the visual builder, export it to C# code, and then you can run it anywhere – without Designer itself, without GUI, without Windows.
How it works:
- Build a strategy in Designer (visually, no code)
- Export to C# (one click)
- Get a console application on StockSharp API
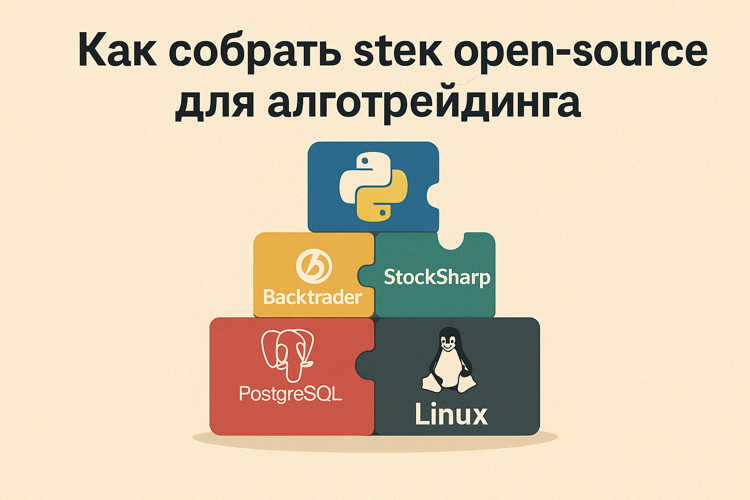
- Run on a Linux server, in a Docker container, on a VPS
Competitors can’t do this. TSLab is permanently tied to its GUI. The strategy lives only inside TSLab, and you can only run it through the program’s interface.
Designer uses StockSharp API as its foundation. The visual builder is simply a convenient wrapper for code generation. But the code you get is ordinary C# that works independently.
Practical implications:
- Run strategy on a server without GUI (headless mode)
- Set up auto-start via systemd (Linux) or Task Scheduler (Windows)
- Monitor via API or logs, without keeping Designer open
- Deploy in Docker for isolation and scaling
It’s like LEAN from QuantConnect – a professional approach. Development through GUI, production through console.
For a home trader this feature is overkill. But if you’re planning serious infrastructure – it’s a killer advantage.
Real-World Experience
What comes together quickly:
Classic indicator strategies. SMA crossover, Bollinger Bands bounce, RSI overbought – all of this assembles in 15-20 minutes.
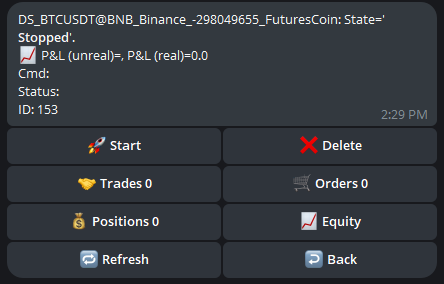
Backtesting works simply: loaded data, ran the test, got results. Win Rate, Profit Factor, Drawdown, equity chart – all on screen.
Parameter optimization: one click – Designer iterates through all combinations and shows the best ones. Dangerous thing, because it’s easy to over-optimize on historical data.
Where problems begin:
When the strategy gets complex. If you have 5-7 conditions – fine. If 20-30 – the diagram turns into spaghetti. Lines between blocks get tangled, hard to understand the logic.
Solution: You can write custom blocks in C#. But if you’re writing in C# – why do you need a visual builder?
Another problem: Documentation is modest. It exists, but it’s not as detailed as one would like. You have to figure things out through trial and error.
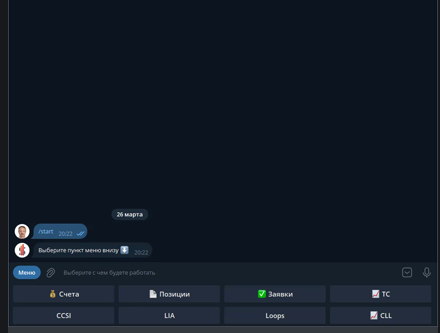
There’s a community (forum, Telegram), but it’s not huge. Questions get answered, but not always quickly.
Pitfalls
Over-optimization is the main danger.
Designer makes optimization too easy. You set a parameter range (e.g., SMA period from 10 to 50), press a button, and the program finds “ideal” values.
On historical data the strategy shows +40% annually. You happily launch it live, and it blows the deposit in a month.
Why? Because the “ideal” parameters are simply perfectly fitted to a specific historical period. It’s not a pattern – it’s an artifact.
How to protect yourself: Walk-Forward testing. Optimize on one period (In-Sample), verify on another (Out-of-Sample). If results differ significantly – discard the strategy.
Second problem: Portability to other platforms.
If you want to move the strategy to Backtrader, LEAN, or MetaTrader – you’ll have to rewrite.
But unlike TSLab, Designer exports the strategy to C# code on StockSharp API. You can run it anywhere without Designer itself – on a server, in Docker, on Linux. The code isn’t the prettiest, but it’s independent.
Third problem: Limitations of the visual approach.
Visual blocks are good for simple logic. But as soon as you need something non-standard (spread trading, arbitrage, news parsing, machine learning) – visual diagrams become unwieldy.
You get a paradox: for simple tasks Designer is overkill (easier to write 10 lines of code), for complex ones – not flexible enough.
Who Designer Is For
Definitely suitable for:
- A trader who knows what works but can’t program
- An analyst who wants to quickly test hypotheses
- Those trading on international exchanges (Binance, IB)
- Open-source enthusiasts
- Those who don’t want to pay for a visual builder
Probably not for:
- Programmers (faster to write code in Python)
- Those planning complex multi-instrument strategies
- High-frequency traders (HFT)
- Those wanting machine learning (better to go straight to Python + sklearn)
Why Free and What About Open-Source
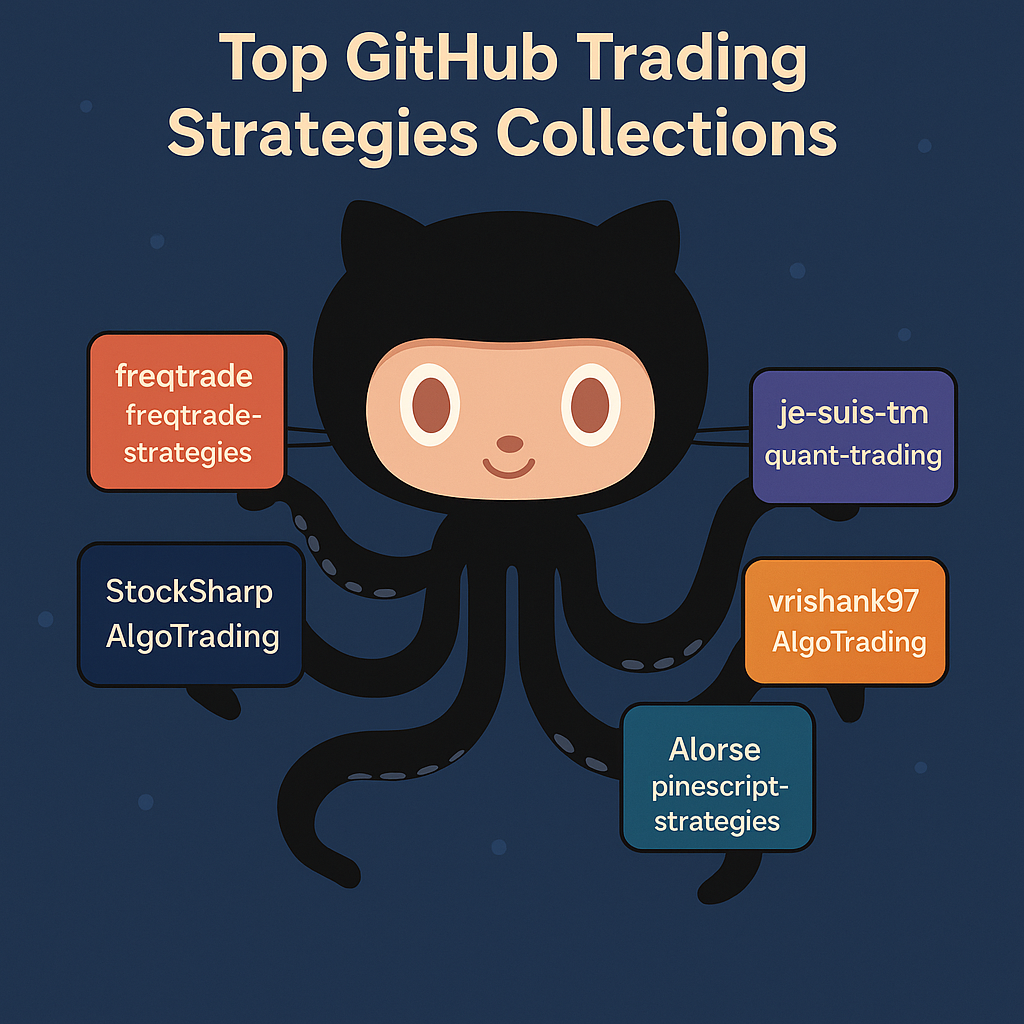
All StockSharp code is on GitHub. You can look at how any indicator works, how the backtester is implemented, how the broker connector is built.
Want to add your own feature? Fork the repository, write code, make a Pull Request. Your feature might get added to the main branch.
Open-source pros:
- Transparency (you see what happens inside)
- Security (you can verify the platform doesn’t steal your API keys)
- Extensibility (you can add anything)
- Independence (export strategy to code and run without Designer)
Open-source cons:
- Nobody guarantees support
- If you find a bug – it might get fixed in a day, might take a month
- Documentation isn’t always current
But for free – you can deal with it.
Honest Answer: Is It Worth It
Yes, if:
- You don’t want to learn programming
- You need to quickly test a simple idea
- You trade on Russian or international markets
- You like the idea of free open-source
- You’re ready to figure things out yourself (documentation isn’t perfect)
No, if:
- You know or are willing to learn Python/C# (then just write code)
- You need complex logic (visual diagrams don’t scale)
- You want high-frequency trading (visual blocks are too slow)
Alternatives
If Designer didn’t work for you, there are options:
Paid visual builders:
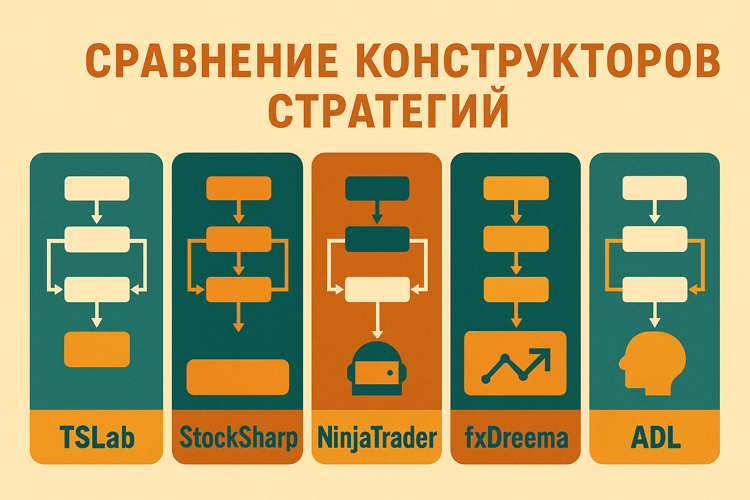
- TSLab (~$600/year or ~$50/month) – a Russian analog of Designer, more polished
- NinjaTrader Strategy Builder – for international markets
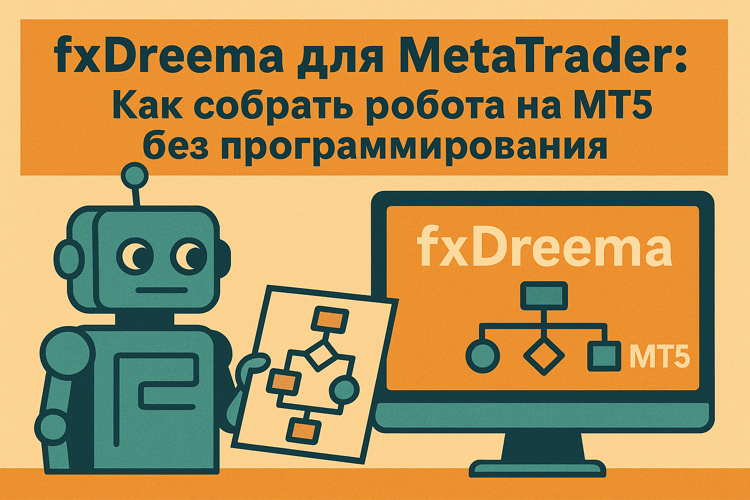
- fxDreema – for MetaTrader 5
Free solutions with code:
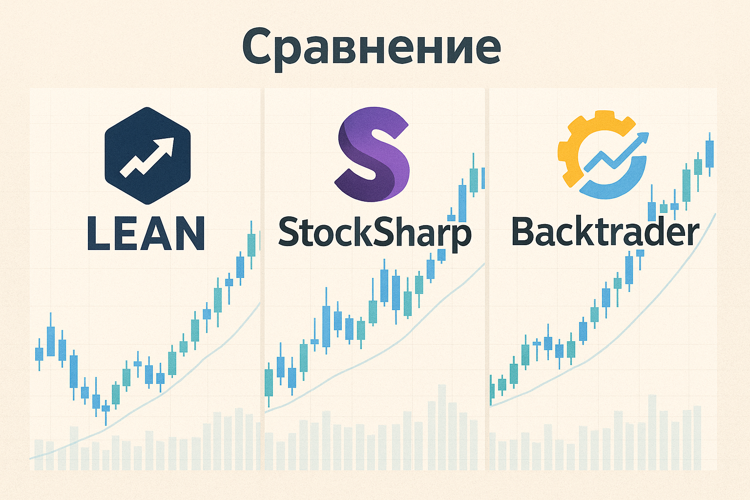
- Backtrader (Python) – requires writing code, but more flexible
- LEAN (C#/Python) – professional level, more complex
Broker platforms:
- QUIK (if your broker supports it, has Lua scripting)
- MetaTrader 5 (MQL5 for strategies)
Conclusions
StockSharp Designer is a free opportunity to try algorithmic trading without programming. For simple indicator strategies, it works fine. For complex ones – you’ll hit the limitations of the visual approach.
Main advantage: Free and open-source. No need to pay hundreds of dollars a year for a license.
Main disadvantage: Documentation and support aren’t at the level of commercial products. You’ll have to figure things out yourself.
Final thought:
Visual builders are crutches. Convenient crutches for those who don’t want to learn programming. But if you’re serious about algorithmic trading, sooner or later you’ll have to learn Python or C#.
Designer (like any visual builder) is great for getting started. Test a few ideas, understand backtesting logic, get familiar with indicators. Then – either migrate to code, or accept the limitations of the visual approach.
But for your first introduction to algorithmic trading – why not. Especially if it’s free.
Useful links:
- StockSharp (main site)
- StockSharp Designer
- GitHub repository
- Documentation
- StockSharp Forum
- Telegram chat
Other articles:
- TSLab: Trading Bots Without Code for $600 a Year – a paid alternative to Designer
What’s next: In the following articles we’ll review other visual builders (NinjaTrader, fxDreema) and compare them all in one table.
Share this article:
Related Posts


Discussion
Join the discussion in our Telegram chat!