Why 95% of Retail Algo Traders Lose Money: A Data-Driven Analysis

The Hard Truth
The “95% of traders lose money” figure has long become a meme, but real data backs it up. Let’s look at why algorithmic trading – especially for retail participants – remains an extremely challenging endeavor.
MOEX Statistics
According to Moscow Exchange data and analysis from Habr:
- 76% of active traders on MOEX are unprofitable over a year
- Among those using algorithmic trading, about ~70% are unprofitable – slightly better, but not radically so
- Average retail algo trader loss: -12% annually (after commissions)
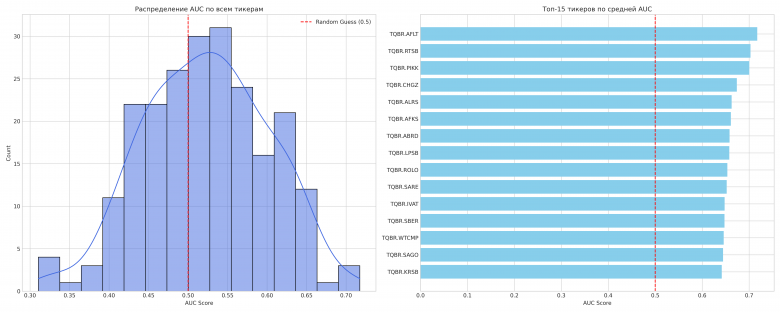
- Only 3-5% consistently profit over a 3+ year horizon
Hidden Costs That Kill Strategies
1. Exchange and Broker Commissions
Typical retail commissions on MOEX:
Exchange commission (stock market):
- Maker: 0.01% of trade volume
- Taker: 0.015% of trade volume

Broker commission:
- From 0.03% to 0.06% (depends on broker and plan)

Total round-trip (open + close):
- Minimum: 0.08% of volume
- Typical: 0.12-0.15% of volume
With 10 trades per day and an average position size of 100,000 rubles:
10 trades × 0.12% × 100,000 = 1,200 RUB/day
× 250 trading days = 300,000 RUB/year
That is 300,000 rubles per year in commissions alone. With a 1,000,000 ruble deposit, that is 30% annually that you need to earn just to break even.
2. Slippage
Slippage is the difference between the price your strategy “wanted” to enter at and the price at which the order actually filled:
- On liquid instruments (Sberbank, Gazprom): 0.01-0.05%
- On less liquid ones: 0.1-0.5%
- During news events: 1-5%+
3. Market Impact
If your order is significant relative to the order book, you move the price against yourself. This is rare for retail traders on liquid instruments, but a serious issue on thinly traded securities.
Why Backtests Lie
Look-ahead Bias
The most common mistake: using data that was not yet available at the time the decision was made. Examples:
- Using the day’s closing price to make a decision on that same day
- Using adjusted data that was changed retroactively
Survivorship Bias
Backtesting on S&P 500 stocks only accounts for companies that survived. Companies that went bankrupt or were acquired are not included in the test sample, creating the illusion of higher returns.
Overfitting
The most insidious enemy:
The more parameters in a strategy,
the better it performs on historical data
and the worse it performs in live markets.
If your strategy has 10+ parameters and shows 200% annual returns on backtest, it is most likely overfitted.
Regime Change
Markets change. A strategy that worked in 2020-2023 may completely stop working in 2024-2026. Examples:
- Volatility strategies designed before COVID broke down during the pandemic
- Momentum strategies tuned for a bull market lose in sideways markets
- Arbitrage strategies “close up” as more people copy them
The Real Cost of Algo Trading
Beyond trading costs:
| Expense Item | Annual Cost |
|---|---|
| Server (VPS/colocation) | 30,000 - 300,000 RUB |
| Data (historical + realtime) | 10,000 - 100,000 RUB |
| Software (platform, tools) | 0 - 50,000 RUB |
| Your own time | priceless |
What to Do If You Still Want to Try
- Start small – with a deposit you can afford to lose
- Account for ALL costs in backtests – commissions, slippage, latency
- Test on out-of-sample data – split history into training and testing sets
- Limit parameter count – the simpler the strategy, the better
- Use walk-forward analysis – regularly review parameters
- Start with paper trading – test the strategy in real time without money
- Diversify – don’t bet everything on a single strategy
Algo trading is not a “money button.” It is serious engineering and analytical work that demands discipline, capital, and honesty with yourself.
Share this article:
Related Posts


Discussion
Join the discussion in our Telegram chat!